🔒 ACCESO EXCLUSIVO: Has desbloqueado herramientas que el 99% de los traders no conoce. Piensas diferente. Operas diferente. EXCLUSIVE ACCESS: You've unlocked tools that 99% of traders don't know about. You think differently. You trade differently. 🔒
⚠ ADVERTENCIA DE RIESGO: El trading implica riesgo sustancial de pérdida. El rendimiento pasado no garantiza resultados futuros. ⚠ RISK WARNING: Trading involves substantial risk of loss. Past performance does not guarantee future results. Leer Disclaimer Completo Read Full Disclaimer
SmallCap Executor Database Creator Blog
Indicators Pricing Custom FAQ
See Pricing 🚀
ES | EN
🚀 Pine Script v6 • Compatible con TradingView 🚀 Pine Script v6 • TradingView Compatible

Detecta Movimientos Institucionales:
Indicadores Premium para TradingView
Detect Institutional Moves:
Premium Indicators for TradingView

3 indicadores avanzados de Pine Script diseñados para darte información crítica en tiempo real. El mismo edge que usan traders profesionales, ahora disponible para ti. 3 advanced Pine Script indicators designed to give you critical real-time information. The same edge used by professional traders, now available to you.

3
Indicadores Pro Pro Indicators
15+
Datos en Tiempo Real Real-Time Data Points
100%
Personalizables Customizable

⚠ Aviso Importante ⚠ Important Notice

Estos indicadores son herramientas educativas y de análisis técnico. NO constituyen asesoría financiera ni recomendaciones de trading. Eres el único responsable de tus decisiones de inversión. El trading implica riesgo sustancial de pérdida de capital. These indicators are educational and technical analysis tools. They do NOT constitute financial advice or trading recommendations. You are solely responsible for your investment decisions. Trading involves substantial risk of capital loss.

TradingView Indicators at a Glance

Indicators Included
Gap Up Stats, Intraday Stats, and Volume Walls — 3 premium Pine Script indicators
Historical Data
Gap Up Stats covers 20+ years (2006-2026), over 50,000 gap events analyzed
Data Points
Intraday Stats provides 16 real-time data points per stock
Platform
TradingView (compatible with all plans including free)
Pricing
$200-$450 lifetime access per indicator or bundle
Best For
Smallcap day traders who want statistical edge from historical data analysis

Premium Indicators vs Free TradingView Indicators

Feature MMI Premium Pack Free TradingView Indicators
Historical Data Depth 20+ years (2006-2026), 50,000+ events Limited to chart timeframe
Gap Analysis Statistical gap probability engine Not available
Institutional Detection Volume Walls algorithm Basic volume bars only
Intraday Data Points 16 real-time metrics per stock 1-3 basic metrics
Smallcap Optimization Built specifically for smallcaps Generic for all markets
Updates & Support Lifetime updates included Community-maintained
🔍 VISTA EXCLUSIVA EXCLUSIVE PREVIEW

Así Se Ve Tu Ventaja Competitiva en Tiempo Real This Is What Your Competitive Edge Looks Like in Real-Time

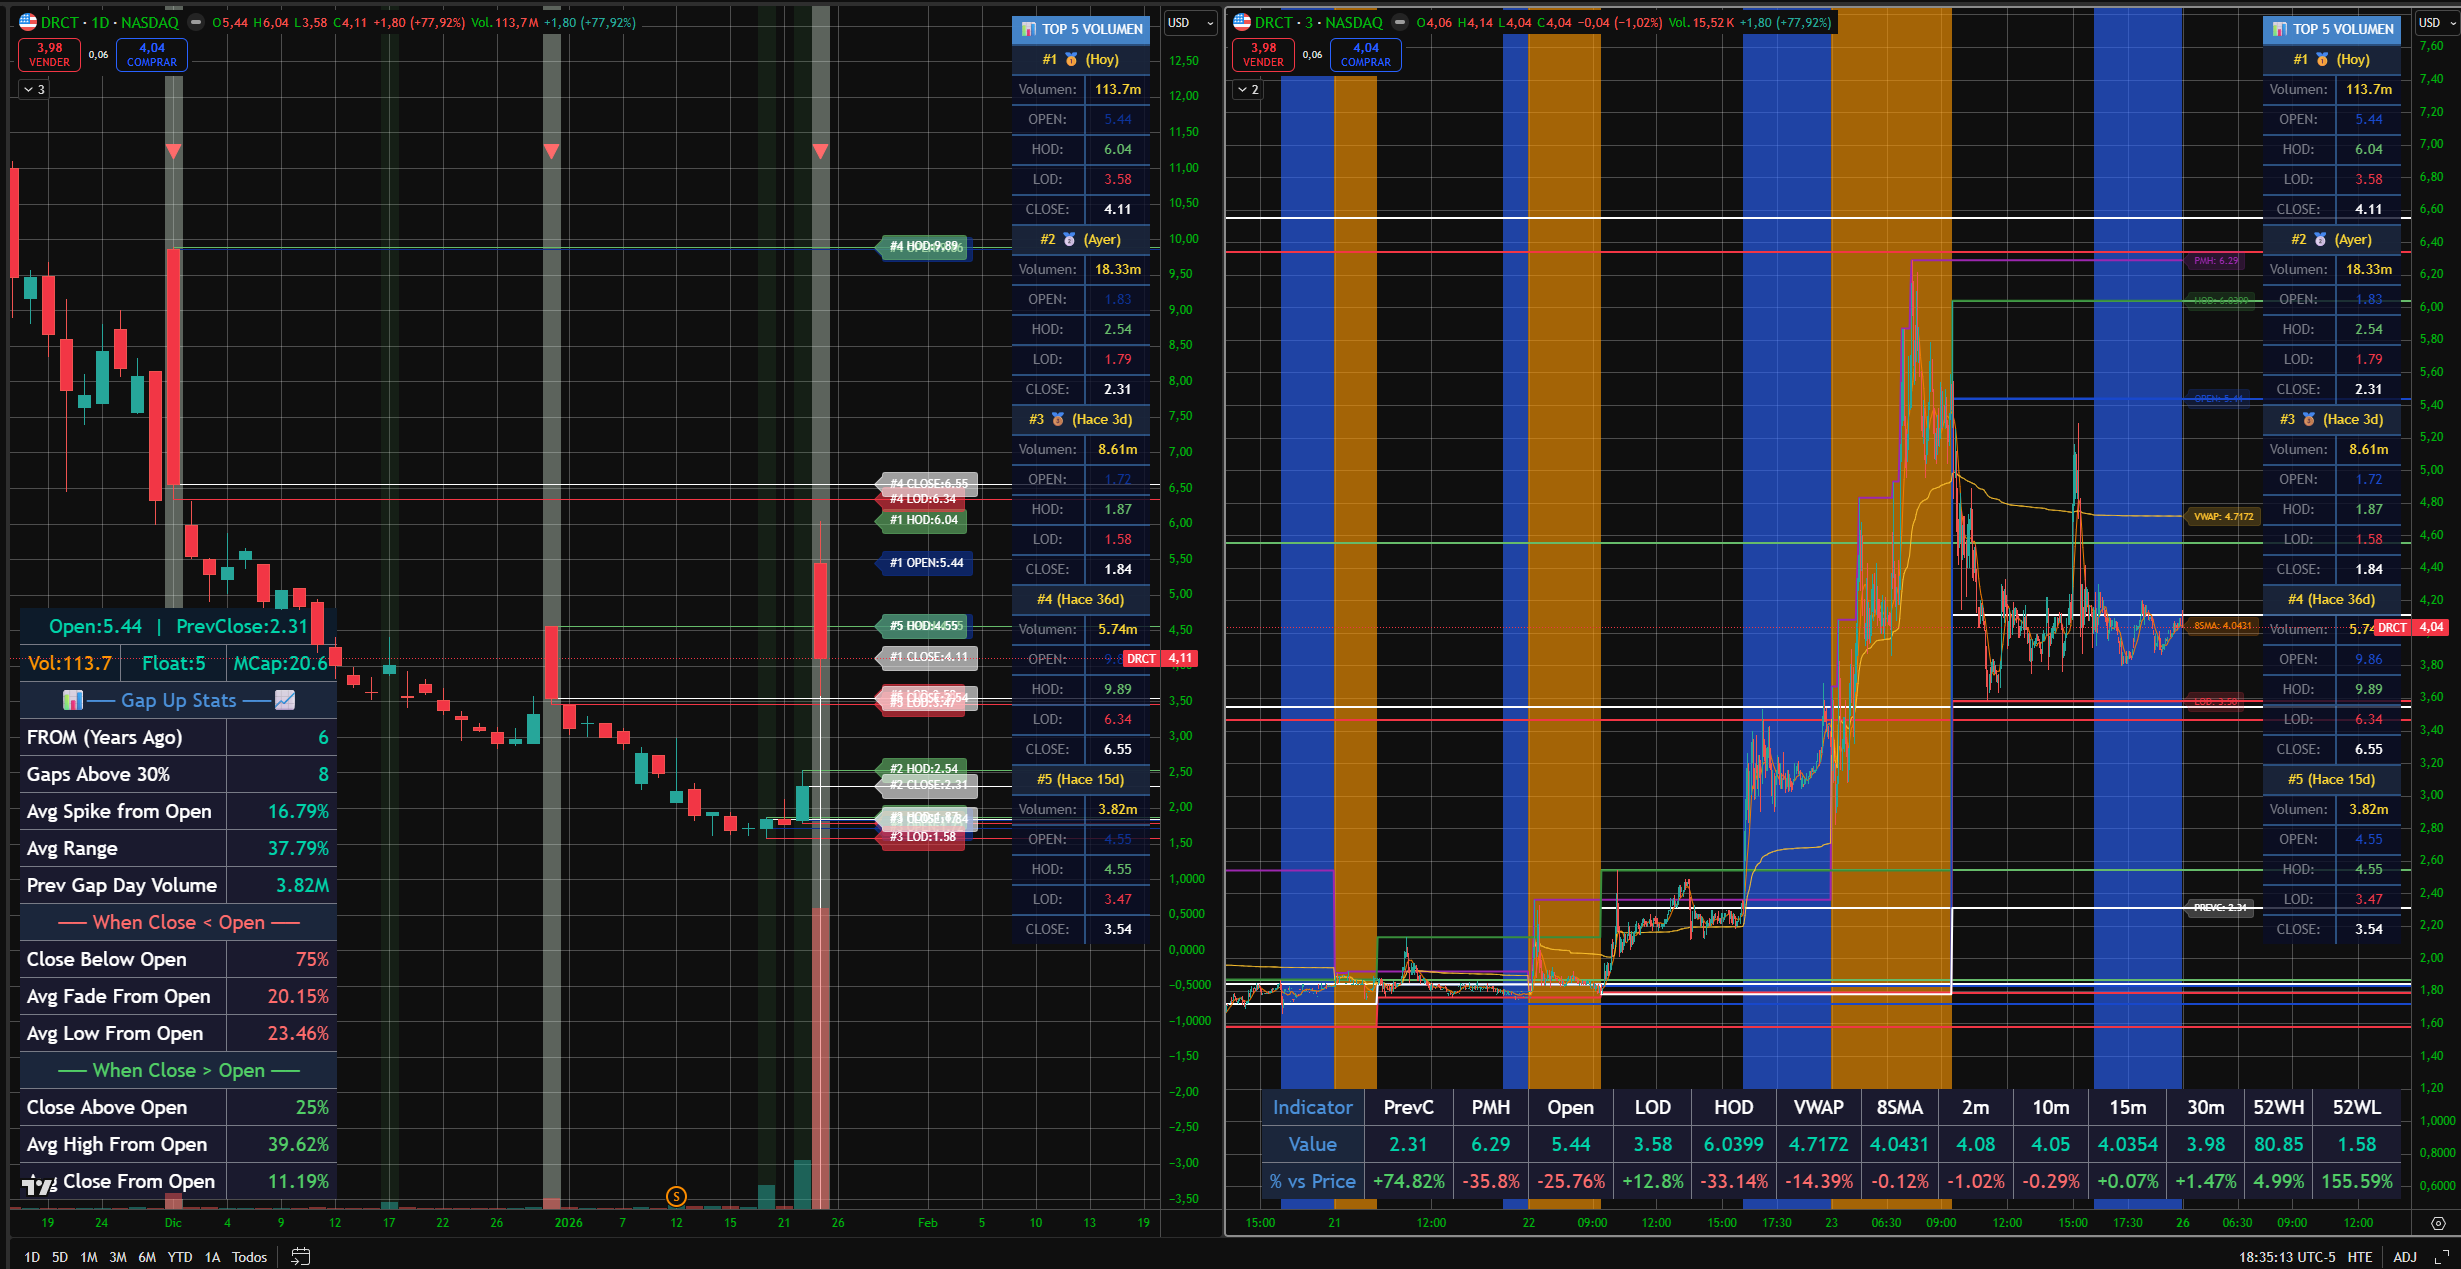
3 indicadores profesionales trabajando juntos. Datos que el 99% de los traders no tienen. Esta es la diferencia entre operar informado y operar a ciegas. 3 professional indicators working together. Data that 99% of traders don't have. This is the difference between trading informed and trading blind.

Triple Indicator Showcase - Gap Up Stats, Intraday Stats, Volume Walls working together in TradingView
🔍 Clic para ampliar 🔍 Click to enlarge
3
Indicadores Pro Pro Indicators
50+
Datos en Tiempo Real Real-Time Data Points
20
Años de Historial Years of History
Acceso de Por Vida Lifetime Access

DISCLAIMER: Esta imagen representa una visualización ilustrativa de los indicadores en un entorno de TradingView. Los datos mostrados son con fines educativos y demostrativos únicamente. El rendimiento pasado no garantiza resultados futuros. El trading implica riesgo sustancial de pérdida de capital. Estos indicadores son herramientas de análisis técnico, NO constituyen asesoría financiera. DISCLAIMER: This image represents an illustrative visualization of the indicators in a TradingView environment. The data shown is for educational and demonstration purposes only. Past performance does not guarantee future results. Trading involves substantial risk of capital loss. These indicators are technical analysis tools, they do NOT constitute financial advice.

¿Por Qué Necesitas Estos Indicadores? Why Do You Need These Indicators?

El tiempo que gastas buscando datos manualmente = oportunidades que se te escapan The time you spend searching for data manually = opportunities you're missing

Ahorra Horas de Análisis Save Hours of Analysis

Lo que antes tomaba horas de investigación manual, ahora lo tienes en segundos. Datos históricos, niveles clave y estadísticas al instante. What used to take hours of manual research, you now have in seconds. Historical data, key levels and statistics instantly.

🎯

Decisiones Basadas en Datos Data-Driven Decisions

Deja de adivinar. Cada indicador te da información estadística real para que tomes decisiones informadas, no emocionales. Stop guessing. Each indicator gives you real statistical information so you make informed decisions, not emotional ones.

Edge Competitivo Competitive Edge

Mientras otros traders operan a ciegas, tú tendrás información que la mayoría no ve. La ventaja que marca la diferencia. While other traders operate blind, you'll have information most don't see. The edge that makes the difference.

📊 Indicador #1 • Lo Usan Traders Profesionales 📊 Indicator #1 • Used by Professional Traders

📊 Gap Up Stats

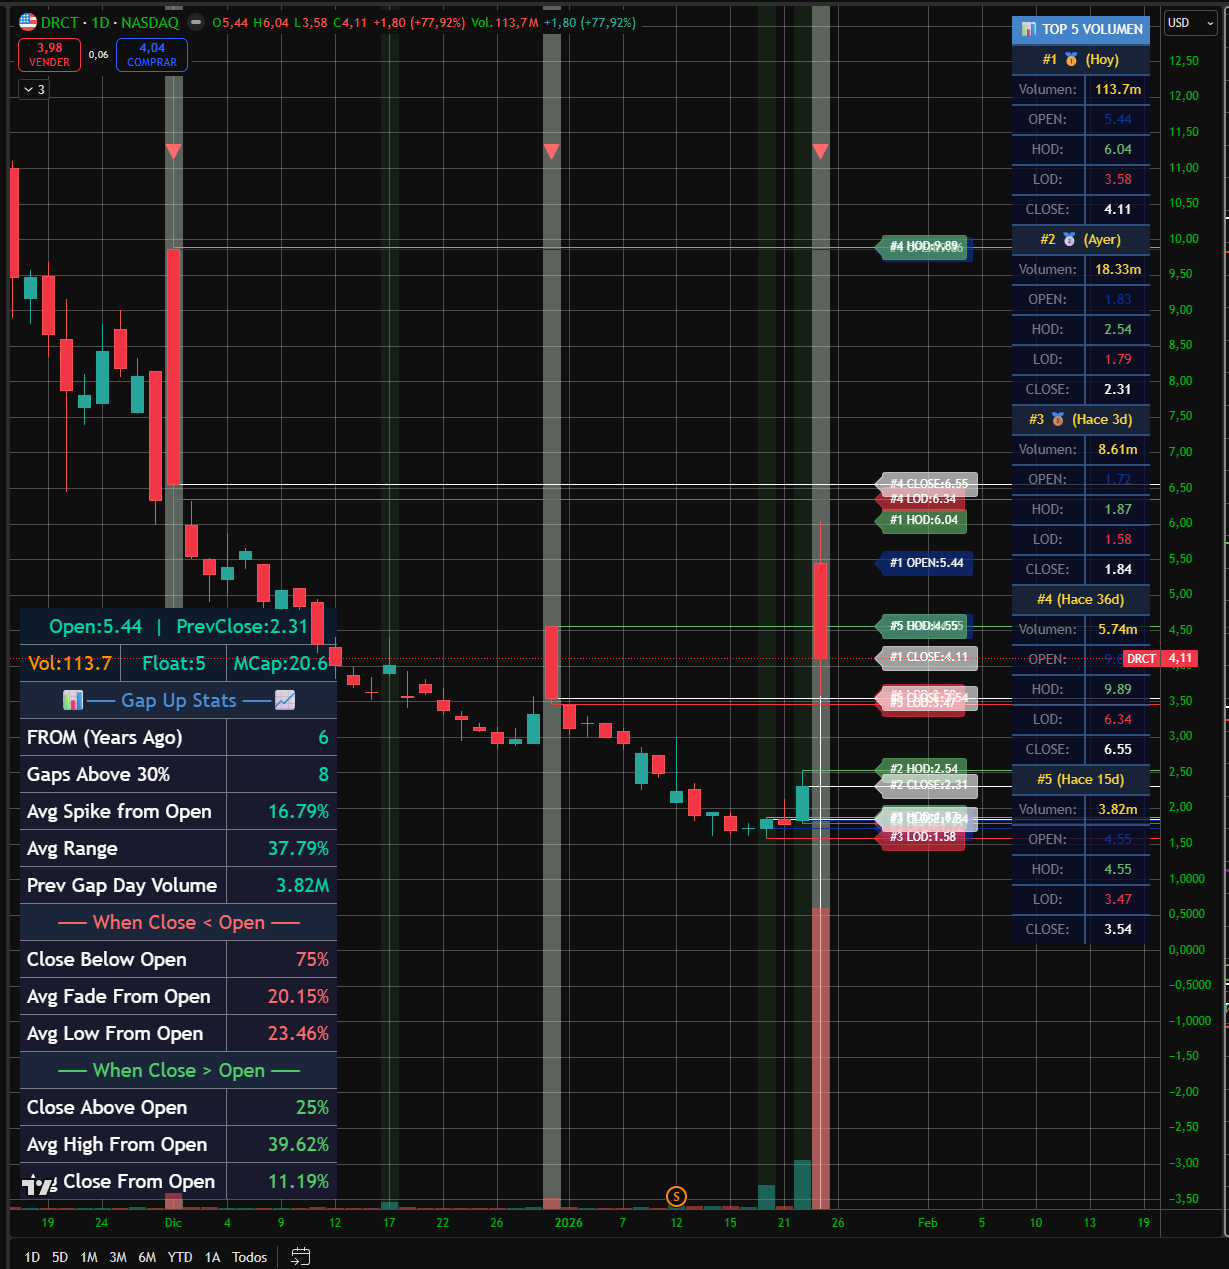
¿Cuántas veces has visto un gap y no sabías si comprar, shortear o esperar? Este indicador elimina las suposiciones. Analiza el comportamiento histórico de CUALQUIER acción en días con gap-up y te dice exactamente qué probabilidad tiene de hacer spike o fade, con datos estadísticos de hasta 20 años. Antes de entrar a un trade, conoce el historial completo del ticker. How many times have you seen a gap and didn't know whether to buy, short, or wait? This indicator eliminates guesswork. It analyzes the historical behavior of ANY stock on gap-up days and tells you exactly what probability it has of spiking or fading, with statistical data from up to 20 years. Before entering a trade, know the complete ticker history.

📈 12 Estadísticas Calculadas Automáticamente: 📈 12 Statistics Calculated Automatically:

Total GapsTotal Gaps Conteo HistóricoHistorical Count
Avg Spike from Open % PromedioAvg %
Rango PromedioAvg Range High-Low %
Close Below Open %Close Below Open % Probabilidad FadeFade Probability
Avg Fade from Open % de Caída% Drop
Avg Low from Open Mínimo TípicoTypical Low
Close Above Open % Probabilidad GreenGreen Probability
Avg High from Open Spike TípicoTypical Spike
Avg Close from Open Cierre PromedioAvg Close
Prev Gap Day Vol Volumen Ref.Ref. Volume
Float & Market Cap Manual/AutoManual/Auto
Open & Prev Close En TablaIn Table
  • ⚠ Exclusivo para gráficos diarios: diseñado específicamente para timeframe D (diario) — analiza gaps entre cierre anterior y apertura siguiente⚠ Daily charts only: designed specifically for D (daily) timeframe — analyzes gaps between previous close and next open
  • Período de análisis: 1-20 años hacia atrás — máximo alcance para datos estadísticamente significativosAnalysis period: 1-20 years back — maximum range for statistically significant data
  • Umbral de gap: 0.1% - 50% personalizable — define qué consideras un "gap real"Gap threshold: 0.1% - 50% customizable — define what you consider a "real gap"
  • 2 secciones estadísticas: Close Below Open (fades) vs Close Above Open (green days)2 statistical sections: Close Below Open (fades) vs Close Above Open (green days)
  • Float manual: ingresa el float en millones para cálculos precisos de Market CapManual float: enter float in millions for precise Market Cap calculations
  • Marcadores visuales: 🔻 triángulos rojos en días de fade, 🔺 verdes en días alcistasVisual markers: 🔻 red triangles on fade days, 🔺 green on bullish days
  • Background highlighting: resalta automáticamente los días de gap en el gráficoBackground highlighting: automatically highlights gap days on chart
  • 2 alertas integradas: "Gap Up Detected" y "Gap Up Faded" para automatización2 built-in alerts: "Gap Up Detected" and "Gap Up Faded" for automation
  • Tabla 100% personalizable: posición (9 ubicaciones), tamaño (5 opciones), colores de fondo/texto/valores100% customizable table: position (9 locations), size (5 options), background/text/value colors
  • Código coloreado: volumen en rojo si <500K, naranja si >10M, blanco normal — identifica liquidez al instanteColor coded: volume in red if <500K, orange if >10M, white normal — identify liquidity instantly
$200 USD • Pago ÚnicoOne-Time Payment
Gap Up Stats Indicator Screenshot
📈 Indicador #2 • El Más Completo del Mercado 📈 Indicator #2 • The Most Complete on the Market

📈 Intraday Stats

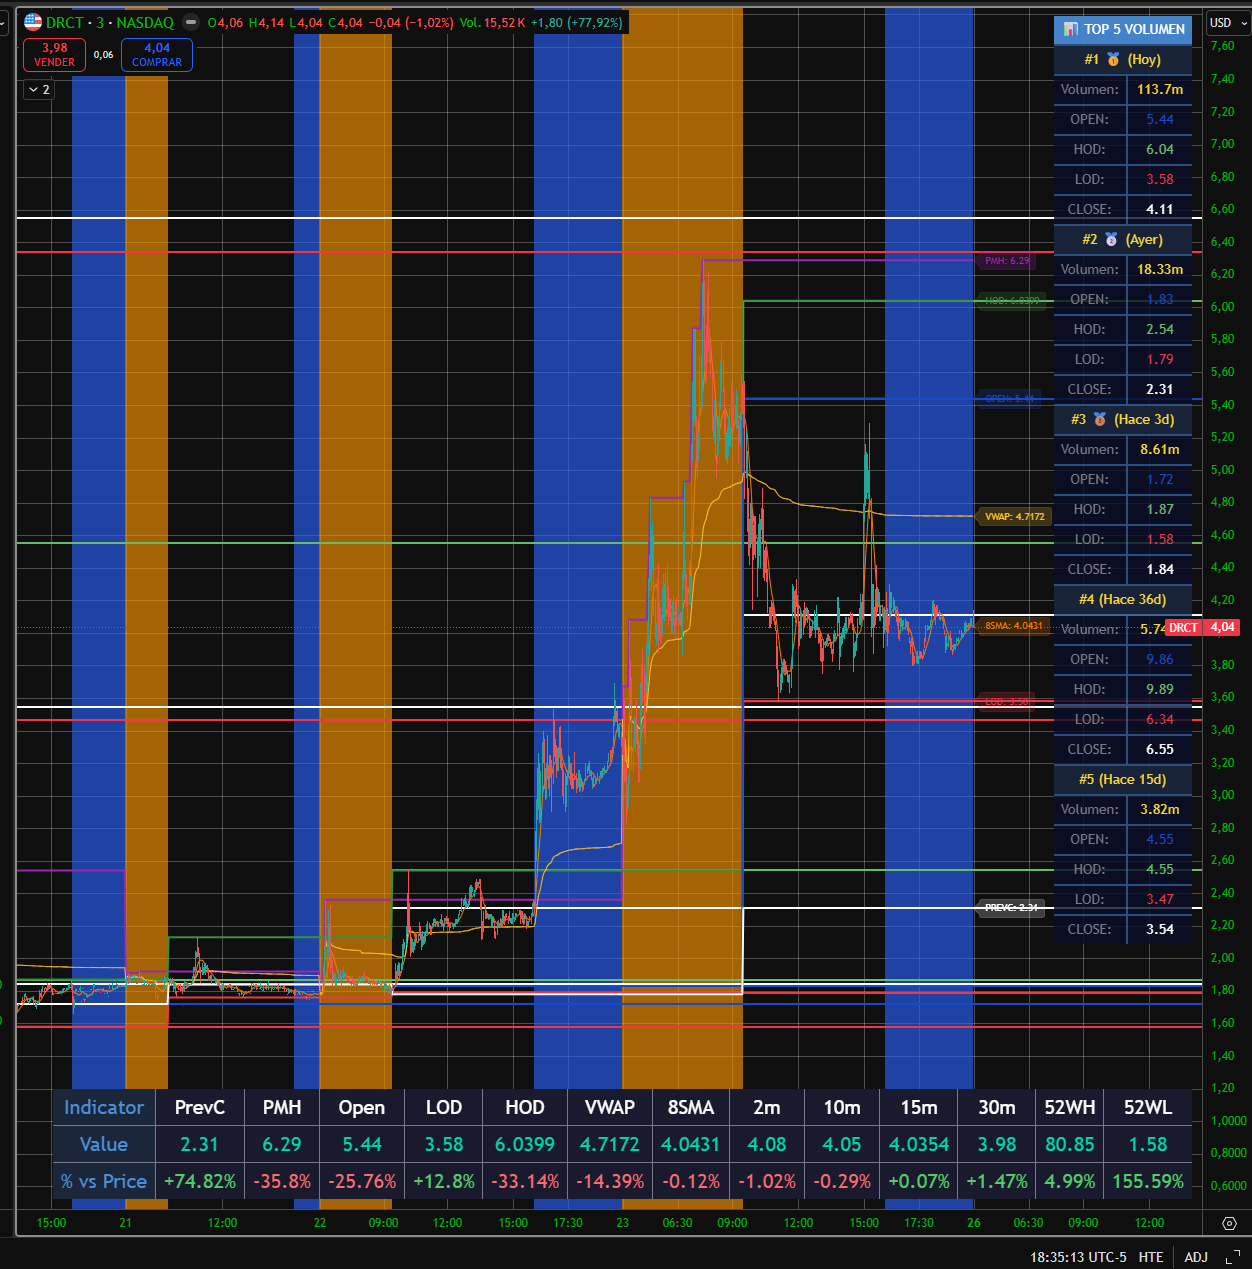
¿Cuántas ventanas tienes abiertas para ver niveles, VWAP, premarket high, y momentum? Intraday Stats consolida todo en un solo panel elegante. Ves al instante dónde está el precio vs. 7 niveles críticos, momentum en 4 timeframes, datos de 52 semanas y hasta información financiera de la empresa. Un trader informado es un trader con ventaja. How many windows do you have open to see levels, VWAP, premarket high, and momentum? Intraday Stats consolidates everything into a single elegant panel. See instantly where price is vs. 7 critical levels, momentum across 4 timeframes, 52-week data and even company financial information. An informed trader is a trader with an edge.

⚡ 16 Puntos de Datos en Tiempo Real: ⚡ 16 Real-Time Data Points:

Previous Close + % vs Price
Premarket High (PMH) AutomáticoAutomatic
Day Open + % vs Price
HOD (High of Day) En Tiempo RealReal-Time
LOD (Low of Day) En Tiempo RealReal-Time
VWAP + % Distance
8 SMA + % Distance
Cambio 2 min2 min Change MomentumMomentum
Cambio 10 min10 min Change MomentumMomentum
Cambio 15 min15 min Change MomentumMomentum
Cambio 30 min30 min Change MomentumMomentum
52 Week High % del Máximo% of High
52 Week Low % desde Mínimo% above Low
Cash En MillonesIn Millions
Debt En MillonesIn Millions
Cash/Debt Ratio Color CodedColor Coded
  • 7 líneas de precio en el gráfico: PMH, HOD, LOD, Open, Prev Close, VWAP, 8 SMA — cada una con toggle individual7 price lines on chart: PMH, HOD, LOD, Open, Prev Close, VWAP, 8 SMA — each with individual toggle
  • 7 etiquetas de precio: labels con precio exacto al lado de cada línea (activables individualmente)7 price labels: labels with exact price beside each line (individually toggleable)
  • PMH automático: calcula el premarket high de 4:00 AM a 9:30 AM ET automáticamenteAutomatic PMH: calculates premarket high from 4:00 AM to 9:30 AM ET automatically
  • Momentum multi-timeframe: ve cómo se está moviendo el precio en 2, 10, 15 y 30 minutosMulti-timeframe momentum: see how price is moving in 2, 10, 15 and 30 minutes
  • 52 Week context: ¿Está el precio cerca de máximos históricos? Color rojo >70%, verde ≤70%52 Week context: Is price near historical highs? Red color >70%, green ≤70%
  • Datos financieros: Cash, Debt y ratio Cash/Debt — verde si ≤10, rojo si >10 (indica riesgo)Financial data: Cash, Debt and Cash/Debt ratio — green if ≤10, red if >10 (indicates risk)
  • 30+ toggles de personalización: muestra/oculta cada dato individual de la tabla30+ customization toggles: show/hide each individual data point in table
  • Colores automáticos: positivo = verde, negativo = rojo para % changes — lectura instantáneaAutomatic colors: positive = green, negative = red for % changes — instant reading
  • Tabla horizontal compacta: indicador, valor, % vs precio — todo organizado en columnas limpiasCompact horizontal table: indicator, value, % vs price — all organized in clean columns
$200 USD • Pago ÚnicoOne-Time Payment
Intraday Stats Indicator Screenshot
🧱 Indicador #3 • Donde Opera el Dinero Institucional 🧱 Indicator #3 • Where Institutional Money Trades

🧱 Volume Walls

¿Sabes dónde están los niveles reales de soporte y resistencia? No hablamos de líneas dibujadas aleatoriamente. Volume Walls encuentra los días con mayor volumen histórico y traza sus niveles OHLC en tu gráfico. Donde el "dinero grande" operó masivamente, el precio tiende a reaccionar. Estos son los verdaderos muros de volumen. Do you know where the real support and resistance levels are? We're not talking about randomly drawn lines. Volume Walls finds the days with highest historical volume and plots their OHLC levels on your chart. Where "big money" traded massively, price tends to react. These are the true volume walls.

🎯 Hasta 40 Líneas de Nivel en tu Gráfico: 🎯 Up to 40 Level Lines on Your Chart:

Top Días VolumenTop Volume Days 1-10 (5 c/tabla)
Lookback 10-500 días10-500 days
Volumen MínimoMin Volume 100K+
OPEN Level Toggle Toggle
HIGH Level Toggle Toggle
LOW Level Toggle Toggle
CLOSE Level Toggle Toggle
Ranking [1ST] [2ND] [3RD]
Días AtrásDays Ago En TablaIn Table
  • Búsqueda inteligente: escanea hasta 500 días de historial para encontrar los días con mayor volumenIntelligent search: scans up to 500 days of history to find the highest volume days
  • Umbral configurable: volumen mínimo desde 100K — filtra el ruido y quédate con lo importanteConfigurable threshold: minimum volume from 100K — filter out noise and keep what matters
  • 4 niveles por día: OPEN, HIGH, LOW, CLOSE — cada uno con toggle individual para mostrar/ocultar4 levels per day: OPEN, HIGH, LOW, CLOSE — each with individual toggle to show/hide
  • Líneas persistentes: se extienden hacia la derecha automáticamente (extend=right)Persistent lines: extend automatically to the right (extend=right)
  • Etiquetas de nivel: labels con formato "#1 HOD:$X.XX" para identificar rápidamente cada nivelLevel labels: labels with "#1 HOD:$X.XX" format to quickly identify each level
  • Tabla informativa ranking: muestra hasta 5 días (#1 [1ST], #2 [2ND], #3 [3RD], #4, #5) — ve el volumen exacto de cada día, hace cuántos días fue, y todos sus niveles OHLCRanking info table: shows up to 5 days (#1 [1ST], #2 [2ND], #3 [3RD], #4, #5) — see exact volume for each day, how many days ago, and all OHLC levels
  • Multi-timeframe: funciona en CUALQUIER timeframe (1min, 5min, 15min, diario, semanal) — no solo gráficos diariosMulti-timeframe: works on ANY timeframe (1min, 5min, 15min, daily, weekly) — not just daily charts
  • Background highlighting: resalta en verde claro los días de alto volumen en tu gráficoBackground highlighting: highlights high volume days in light green on your chart
  • 15+ opciones de personalización: colores para cada nivel (OHLC), grosor de líneas, tamaño de labels, posición de tabla15+ customization options: colors for each level (OHLC), line width, label size, table position
  • Actualización en tiempo real: la tabla y líneas se actualizan automáticamente en cada barraReal-time updates: table and lines update automatically on each bar
$200 USD • Pago ÚnicoOne-Time Payment
Volume Walls Indicator Screenshot

🛡️ Tu Trading: Con Indicadores vs Sin Indicadores 🛡️ Your Trading: With Indicators vs Without Indicators

La diferencia entre operar con información y operar a ciegas. Los resultados hablan por sí solos.* The difference between trading with information and trading blind. The results speak for themselves.*

✗ Trader SIN Estos Indicadores ✗ Trader WITHOUT These Indicators

  • ✗ Ve un gap y no sabe si hará spike o fade ✗ Sees a gap and doesn't know if it will spike or fade
  • ✗ Busca niveles manualmente en múltiples ventanas ✗ Searches for levels manually across multiple windows
  • No sabe el momentum de los últimos 10, 15, 30 minutos Doesn't know momentum from last 10, 15, 30 minutes
  • Ignora dónde operó el dinero institucional Ignores where institutional money traded
  • ✗ Dibuja líneas de S/R al azar ✗ Draws S/R lines randomly
  • Pierde tiempo calculando % desde niveles Wastes time calculating % from levels
  • ✗ Entra trades basado en suposiciones ✗ Enters trades based on assumptions
  • Desventaja competitiva vs traders informados Competitive disadvantage vs informed traders

✅ Trader CON Estos Indicadores ✅ Trader WITH These Indicators

  • ✅ Ve un gap y sabe el % histórico de spike vs fade ✅ Sees a gap and knows the historical % of spike vs fade
  • Todos los niveles en un panel elegante All levels in one elegant panel
  • Momentum en tiempo real a 2, 10, 15 y 30 min Real-time momentum at 2, 10, 15 and 30 min
  • Sabe exactamente dónde hay muros de volumen Knows exactly where volume walls are
  • ✅ S/R basados en datos reales de volumen ✅ S/R based on real volume data
  • % instantáneo desde cada nivel crítico Instant % from each critical level
  • ✅ Entra trades basado en datos estadísticos ✅ Enters trades based on statistical data
  • Edge informativo sobre otros traders Information edge over other traders

¿De qué lado de la mesa quieres estar? Which side of the table do you want to be on?

🚀 Ver Precios y Obtener la Ventaja 🚀 See Pricing and Get the Edge

*Esta comparación es ilustrativa sobre el acceso a información, no una garantía de resultados. Tener más información no garantiza ganancias. El trading implica riesgo. Los resultados pasados no garantizan resultados futuros. Consulta el disclaimer completo para más información. *This comparison is illustrative about access to information, not a guarantee of results. Having more information does not guarantee profits. Trading involves risk. Past results do not guarantee future results. See full disclaimer for more information.

Elige Tu Indicador Choose Your Indicator

Pago único, acceso de por vida. Sin suscripciones, sin cargos recurrentes. One-time payment, lifetime access. No subscriptions, no recurring charges.

📊

Gap Up Stats

Análisis histórico de gap-ups Historical gap-up analysis

$200 USD
  • Estadísticas históricas 1-20 añosHistorical statistics 1-20 years
  • Probabilidad de fade vs spikeFade vs spike probability
  • Marcadores visuales en gráficoVisual markers on chart
  • ⚠ Solo timeframe diario⚠ Daily timeframe only
  • Soporte por email y WhatsAppEmail and WhatsApp support
💬 Consultar por WhatsApp 💬 Ask on WhatsApp
📈

Intraday Stats

Dashboard intradía completo Complete intraday dashboard

$200 USD
  • Todos los niveles clave (PMH, HOD, LOD)All key levels (PMH, HOD, LOD)
  • VWAP y 8 SMA integradosVWAP and 8 SMA integrated
  • Momentum multi-timeframeMulti-timeframe momentum
  • 52 Week positioning52 Week positioning
  • Soporte por email y WhatsAppEmail and WhatsApp support
💬 Consultar por WhatsApp 💬 Ask on WhatsApp
🧱

Volume Walls

Niveles de alto volumen High volume levels

$200 USD
  • Top 5 días de volumen históricoTop 5 historical volume days
  • Líneas de soporte/resistenciaSupport/resistance lines
  • Funciona en cualquier timeframeWorks on any timeframe
  • Hasta 500 días lookbackUp to 500 days lookback
  • Soporte por email y WhatsAppEmail and WhatsApp support
💬 Consultar por WhatsApp 💬 Ask on WhatsApp
🛡️

Bundle Completo Full Bundle

Los 3 indicadores juntos All 3 indicators together

$600 USD
$450 USD
  • 📊 Gap Up Stats incluidoincluded
  • 📈 Intraday Stats incluidoincluded
  • 🧱 Volume Walls incluidoincluded
  • Ahorra $150 USD (25% descuento)Save $150 USD (25% discount)
  • Soporte prioritarioPriority support
💬 Consultar por WhatsApp 💬 Ask on WhatsApp
50% OFF

👑 Descuento Exclusivo Edge Society 👑 Exclusive Edge Society Discount

Los miembros de The Edge Society obtienen 50% de descuento en todos los indicadores. ¿Eres miembro? Contáctanos por WhatsApp para obtener tu precio especial. Members of The Edge Society get 50% off all indicators. Are you a member? Contact us via WhatsApp to get your special price.

💬 Reclamar 50% OFF por WhatsApp 💬 Claim 50% OFF via WhatsApp
🚀⭐

¿Tienes una Idea? Nosotros la Programamos Have an Idea? We'll Code It

Desarrollamos indicadores y herramientas de análisis técnico a medida para cualquier plataforma que soporte código: We develop custom indicators and technical analysis tools for any platform that supports code:

📊 TradingView (Pine Script) 📈 ThinkOrSwim (ThinkScript) 🐍 Python / Jupyter ⚡ NinjaTrader 🛠️ MT4/MT5 (MQL) 💻 Y más...And more...

🎯 Tú Mandas, Tu Imaginación es el Límite 🎯 You're in Charge, Your Imagination is the Limit

  • Indicadores personalizados con la lógica exacta que necesitas Custom indicators with the exact logic you need
  • Screeners y alertas automatizadas para tu estrategia Screeners and alerts automated for your strategy
  • Backtesting tools para validar tus ideas antes de operar Backtesting tools to validate your ideas before trading
  • Integración de datos externos (APIs, Excel, bases de datos) External data integration (APIs, Excel, databases)
  • Cotización sin compromiso — cuéntanos tu idea y te respondemos rápido No-obligation quote — tell us your idea and we'll respond quickly
💬 Cuéntanos Tu Idea por WhatsApp 💬 Tell Us Your Idea via WhatsApp

[@] O escríbenos a: info@mariomaldonado.com [@] Or email us at: info@mariomaldonado.com

*Las herramientas personalizadas son para fines educativos y de análisis técnico. No constituyen asesoría financiera. El uso de cualquier herramienta de trading es bajo tu propia responsabilidad. Resultados pasados no garantizan resultados futuros. *Custom tools are for educational and technical analysis purposes. They do not constitute financial advice. The use of any trading tool is at your own risk. Past results do not guarantee future results.

Preguntas Frecuentes Frequently Asked Questions

Todo lo que necesitas saber sobre los indicadores Everything you need to know about the indicators

¿Cómo recibo los indicadores después de comprar? How do I receive the indicators after purchasing? +

¡Es automático e inmediato! Una vez completes tu pago, solo necesitas proporcionarnos tu nombre de usuario de TradingView. Nosotros te damos acceso directamente a través de tu cuenta de TradingView. It's automatic and immediate! Once you complete your payment, you just need to provide us with your TradingView username. We grant you access directly through your TradingView account.

  • No necesitas hacer nada — no copiar código, no pegar scriptsYou don't need to do anything — no copying code, no pasting scripts
  • Acceso inmediato — una vez nos des tu usuario, lo activamos al instanteImmediate access — once you give us your username, we activate it instantly
  • Solo abre TradingView — ve a Indicadores, busca el nombre y listoJust open TradingView — go to Indicators, search the name and done

El indicador aparecerá automáticamente en tu lista de "Invite-Only Scripts" dentro de TradingView. The indicator will automatically appear in your "Invite-Only Scripts" list within TradingView.

¿Funcionan con cualquier cuenta de TradingView? Do they work with any TradingView account? +

Sí, los indicadores funcionan con cualquier plan de TradingView (Free, Pro, Pro+, Premium). Sin embargo, ten en cuenta que la cuenta gratuita tiene limitaciones en el número total de indicadores que puedes tener activos simultáneamente. Yes, the indicators work with any TradingView plan (Free, Pro, Pro+, Premium). However, keep in mind that the free account has limitations on the total number of indicators you can have active simultaneously.

¿Los indicadores funcionan con cualquier símbolo/ticker? Do the indicators work with any symbol/ticker? +

Sí, los indicadores están diseñados para funcionar con acciones, ETFs y la mayoría de instrumentos disponibles en TradingView. Funcionan mejor con acciones de USA pero son compatibles con mercados internacionales. Yes, the indicators are designed to work with stocks, ETFs and most instruments available on TradingView. They work best with US stocks but are compatible with international markets.

¿Hay reembolsos disponibles? Are refunds available? +

Debido a la naturaleza digital del producto (código Pine Script), no ofrecemos reembolsos una vez entregado el código. Sin embargo, si tienes problemas técnicos con el indicador, nuestro equipo de soporte te ayudará a resolverlos. Due to the digital nature of the product (Pine Script code), we do not offer refunds once the code is delivered. However, if you have technical issues with the indicator, our support team will help you resolve them.

¿Recibo actualizaciones futuras? Do I receive future updates? +

Sí, cualquier mejora o actualización del indicador que compres será enviada a tu email sin costo adicional. Tu compra incluye acceso de por vida a las actualizaciones. Yes, any improvement or update to the indicator you purchase will be sent to your email at no additional cost. Your purchase includes lifetime access to updates.

¿Cómo obtengo el descuento de Edge Society? How do I get the Edge Society discount? +

Si eres miembro activo de The Edge Society, contáctanos por WhatsApp con tu comprobante de membresía. Te responderemos con el link de pago con el 50% de descuento aplicado. If you're an active member of The Edge Society, contact us via WhatsApp with your membership proof. We'll respond with the payment link with the 50% discount applied.

Complete Your Trading Edge

Explore our full suite of educational trading tools

SmallCap Executor

Automated order execution in under 3 seconds via DAS Trader API

Database Creator

Trading data organizer with Discord bot for 24/7 alerts

Indicator Preview
📈
15
traders usando traders using
👤
Indicator Preview